
A Century of American Home Prices
A Century of American Home Prices: From The Great Depression to Today's Market
Thomas Brady
1/6/20254 min read
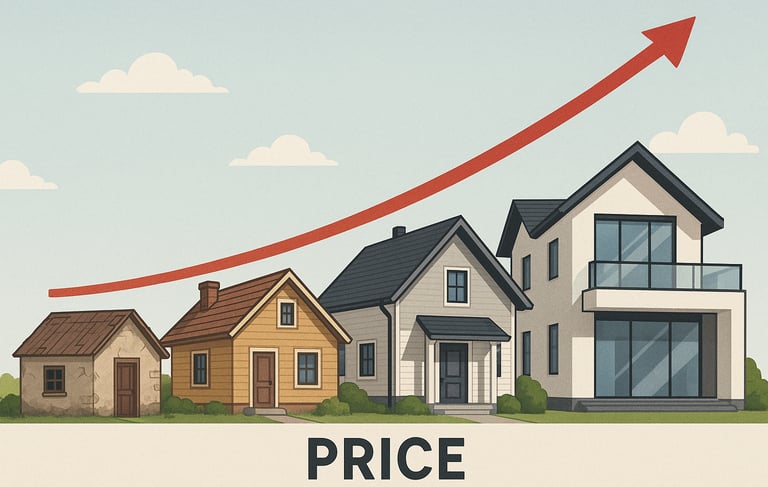
A Century of American Home Prices: From The Great Depression to Today's Market 🏠📈
Have you ever wondered how much your grandparents paid for their first home? Or how today's housing market compares to decades past? Let's take a fascinating journey through nearly 100 years of American housing history! 🕰️
The Great Depression & Post-War Boom (1926-1950s) 📉➡️📈
In 1926, the median U.S. home price was approximately $7,700 (about $127,000 in today's dollars). Can you imagine? 😮 Then came the Great Depression, causing home values to plummet by roughly 30% between 1928 and 1933. Home prices didn't recover to pre-Depression levels until after the 1930s.
The timeline tells the story:
1926-1933: Home prices fall 30% during the Great Depression 📉
1940s: Post-WWII economic expansion leads to suburban development 🏗️
1950: Median home price reaches $8,450 ($101,000 in 2025 dollars) 💰
Late 1950s: Median home price increases to $12,400 📈
The post-World War II boom saw rapid suburban development and the rise of tract housing. The G.I. Bill was a game-changer, providing veterans with mortgage assistance and dramatically increasing homeownership rates. Developments like Levittown offered new homes for under $10,000, making homeownership accessible to the middle class. The American Dream was becoming reality for millions! 🇺🇸
Inflation and Growth (1960s-1970s) 💵📈
Home prices began rising more rapidly during the 1960s as inflation increased. By 1970, the median home price reached approximately $23,600 (about $177,000 in today's dollars). The 1970s saw significant inflation, with home prices nearly doubling over the decade to around $47,200 by 1980.
Key numbers:
1970 Median Price: $23,600 (Equivalent to $177,000 in 2025 dollars) 🏠
1980 Median Price: $47,200 (Equivalent to $166,000 in 2025 dollars) 🏡
Price Increase: Home prices nearly doubled during the 1970s! 📊
This period marked the beginning of more substantial home price growth that would characterize later decades, though homes remained relatively affordable at 2-3 times median household income. Those were the days! 😌
Volatility and Regional Divergence (1980s-1990s) 📊🗺️
The early 1980s recession and high interest rates (reaching over 18% for mortgages—can you imagine?! 😱) temporarily suppressed home prices. Regional differences became more pronounced, with coastal markets appreciating faster than the Midwest and rural areas.
Notable events:
Early 1980s: Recession and high interest rates suppress prices 📉
1990: Median price reaches $79,100 ($175,000 in 2025 dollars) 💰
Early 1990s: Housing slump, particularly in California and Northeast 🏘️
Late 1990s: Renewed price growth as economy strengthens 📈
The early 1990s saw a notable housing slump, particularly in California and the Northeast, before the late 1990s brought renewed price growth as the economy strengthened. This period established the pattern of regional housing markets moving at different paces. Location, location, location became more important than ever! 📍
Housing Bubble and Crash (2000-2008) 🎈💥
From 2000-2006, home prices increased at an unprecedented rate, with the median price reaching approximately $230,000 by 2006. Subprime lending, speculation, and relaxed credit standards fueled an unsustainable housing bubble.
The Case-Shiller Home Price Index increased by over 80% between 2000 and mid-2006. 📈 The subsequent crash saw national home values decline by approximately 33% between 2006 and 2012. Millions of homeowners faced foreclosure, with some markets experiencing price declines of over 50%. It was a devastating time for many American families. 💔
Recovery and Pandemic Impact (2012-2025) 🏥📈
Housing markets began a sustained recovery in 2012. By 2016, national home prices had recovered to their pre-crash levels in nominal terms. Low interest rates and limited housing inventory contributed to price growth, with the median home price reaching approximately $320,000 by 2019.
The timeline:
2012-2019: Recovery - Sustained growth brings prices back to pre-crash levels by 2016 🔄
2020-2022: Pandemic Boom - Record-low interest rates and remote work drive unprecedented price growth 🚀
2022-2023: Cooling - Interest rate increases cool the market somewhat ❄️
2025: Current Market - Median existing home price stands at approximately $425,000 💲
The COVID-19 pandemic initially caused market uncertainty, but prices rose dramatically from mid-2020 through 2022. Record-low interest rates, remote work migration patterns, and limited inventory drove unprecedented price growth to today's median of $425,000. What a wild ride! 🎢
Key Factors Influencing Home Prices 🧩
Multiple economic indicators, demographic trends, supply constraints, and regional factors have shaped the U.S. housing market over the past century.
Economic Indicators 📉📈
Interest rates show strong inverse correlation with price growth
Income levels generally track with economic prosperity
Housing markets perform best during low unemployment
Demographic Trends 👨👩👧👦
Baby Boomers drove demand from 1970s-2000s
Millennials became largest homebuying demographic in late 2010s
Recent trends show delayed family formation
Supply Constraints ⚠️
Construction has lagged behind population growth since 2008
Zoning restrictions limit housing in high-demand areas
Material costs and labor shortages reduce construction
Regional Disparities 🗺️
Coastal markets show greatest long-term appreciation
Sunbelt states experienced rapid growth since 2000s
Rust Belt cities show more modest price appreciation
Affordability and Future Outlook 🔮
Housing affordability has declined significantly over the decades. From the 1950s-1970s, home prices typically ranged from 2-3 times median household income, increasing to 3-3.5 times in the 1980s-1990s, and reaching 5.2 times income by 2025. Ouch! 😬
What's ahead? A mix of:
Future Uncertainties: Interest rates, remote work, affordability constraints ❓
Growth Factors: Supply shortages, demographic shifts, climate considerations 📈
Historical Performance: 1-2% annual real appreciation over the past century 📊
Looking forward, persistent supply shortages, millennial and Gen Z homebuyers entering their prime purchasing years, climate considerations, and infrastructure investment suggest continued pressure on housing prices. However, affordability constraints, a changing interest rate environment, and remote work adjustments present challenges to rapid appreciation.
The century-long view suggests that while real estate remains a cornerstone of wealth building for many Americans, appreciation will likely remain uneven across regions and subject to broader economic conditions. The journey continues! 🏠🔑
Vintage American Realty, LLC
Vintage American Realty, LLC is licensed in the State of New York
office: 631.319.4564
broker: 631.816.0719
info@vintageamericanrealty.com
1551 Montauk Hwy, Ste E
Oakdale, NY 11769
Long Island, NY